KMFS Blog
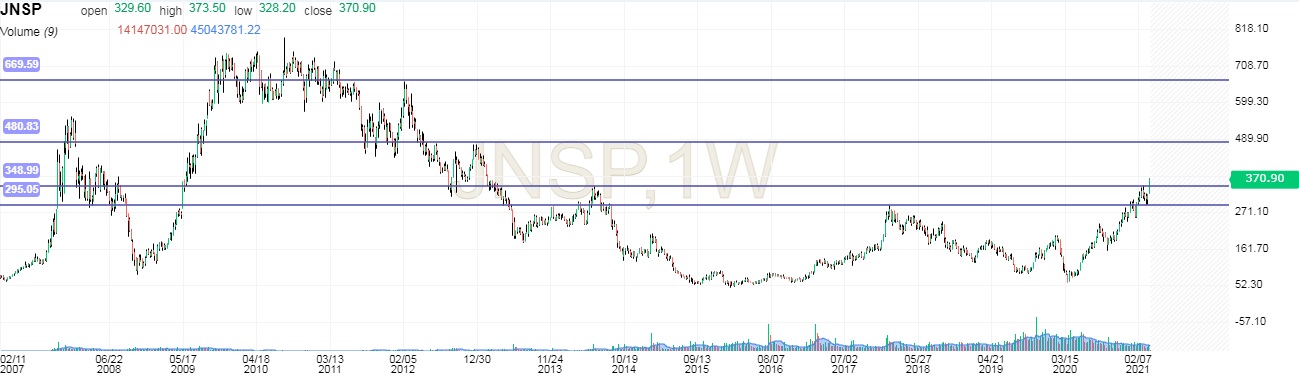
Chart of Jindal Steel & Power Ltd...
Why to Buy -
1. Fresh Breakout can be seen on Weekly Chart.
2. Over the last 5 years, revenue has grown at a yearly rate of 17.42%, vs industry avg of 3.21%
3. Over the last 5 years, market share increased from 5.04% to 9.66%
4. In last 3 months, mutual fund holding of the company has increased by 1.39%
Negative point -
1.A significant proportion of promoter holdings is pledged.
TARGETS & STOP LOSS MENTIONED ON CHART ..
DISCLAIMER - NOT A SEBI REGISTERED ADVISOR. KINDLY CONSULT YOUR FINANCIAL ADVISOR BEFORE INVESTING.
TO KNOW HOW TO GENERATE SUCH RESEARCH CALLS ...JOIN OUR E - LEARNING COURSES ...
RAJESH JAIN - 9440343805.

